
Three weeks ago, a B2B software company hired their fourth social media manager in two years. Each one quit for the same reason: getting blamed for pipeline problems they couldn't prove they influenced. Their CEO kept asking "what's the ROI of our 50k LinkedIn followers?" while their sales team complained that social leads were garbage. Marketing ops had built seventeen different dashboards, none of which actually connected social activity to revenue.
The attribution nightmare that breaks most marketing operations
Three weeks ago, a B2B software company hired their fourth social media manager in two years. Each one quit for the same reason: getting blamed for pipeline problems they couldn't prove they influenced. Their CEO kept asking "what's the ROI of our 50k LinkedIn followers?" while their sales team complained that social leads were garbage. Marketing ops had built seventeen different dashboards, none of which actually connected social activity to revenue.
This breakdown happens in most growing companies once they hit around $5-10M in revenue. The social team posts content, engagement looks good, but nobody can draw a straight line from a LinkedIn comment to a closed deal six months later. When budgets get tight, social gets cut first because "we can't measure the impact."
The real problem isn't that social media can't be measured. It's that most companies try to measure it like they measure Google Ads – last-click attribution, direct response metrics, immediate conversions. That's like judging a farmer by counting seeds instead of tracking the harvest.
Why traditional attribution breaks for social media
Marketing attribution works great when someone searches "project management software," clicks an ad, and buys. Clean path, clear intent, measurable outcome. Social media operates completely differently.
Stop managing your social media the hard way.
Postyly helps you plan, schedule, and analyze every post with precision.
- Multi-platform scheduling
- Real-time engagement tracking
- Automated performance reports
No credit card required
A typical social-influenced B2B purchase path looks more like this: Someone sees your post about inventory management problems in their LinkedIn feed. They don't click anything. Three weeks later, they mention it to a colleague during lunch. That colleague googles your company name two months later, downloads a guide from your website, ignores your emails for six weeks, then suddenly books a demo after their current vendor raises prices.
Your attribution software credits the demo to "direct traffic" or maybe that guide download. The social post that started everything? Invisible.
Most companies respond by either ignoring social metrics entirely or obsessing over vanity metrics that don't connect to business outcomes. They'll celebrate hitting 10k followers while their pipeline dries up, or panic about engagement rates dropping while their best customers are quietly influenced by their content.
The worst part happens when companies actually do generate revenue from social but can't prove it. A SaaS company cut their social budget by 70% because they couldn't show direct attribution. Six months later, their organic demo requests dropped by 40%. They never made the connection because the delay was too long and the path too indirect.
Mapping metrics to actual funnel stages
Most companies get this wrong: they use the same metrics for every stage of the funnel. Measuring awareness with conversion rates makes as much sense as measuring consideration with impressions. Each funnel stage needs different metrics because the buyer behavior is fundamentally different.
Awareness Stage (They don't know you exist)
-
Reach from non-followers (not total reach)
-
Share rate from first-time viewers
-
Save/bookmark rate on educational content
-
Brand mention velocity (how often others reference you)
-
Earned media value (when others create content about you)
A cybersecurity startup tracked the wrong awareness metrics for months. They celebrated total impressions going up, but 90% came from their existing followers seeing the same content repeatedly. When they switched to tracking reach from non-followers, they realized their actual awareness wasn't growing at all. They shifted strategy to collaborative content and employee advocacy, growing their non-follower reach by 300% in four months.
Consideration Stage (They know the problem, exploring options)
-
Profile visits after content engagement
-
Website traffic from social (with proper attribution)
-
Content saves and shares to colleagues
-
Multi-touch engagement (people who interact repeatedly)
-
Time spent watching videos or reading articles
-
Click-through rate on problem-focused content (not product content)
The behavior pattern here is research mode. Someone might watch three of your YouTube videos about inventory management challenges, save your LinkedIn post about warehouse efficiency, then visit your profile to see what else you've published. None of these actions indicate purchase intent yet, but they show consideration behavior.
Decision Stage (Ready to evaluate solutions)
-
Engagement on case studies and customer stories
-
Direct messages asking about pricing or features
-
Tags from prospects asking colleagues for opinions
-
Website conversion rate from social traffic (not just traffic volume)
-
Demo requests that mention social content
-
Sales cycle length for social-influenced deals
A marketing agency discovered their LinkedIn case studies generated 3x more qualified leads than their educational content, but only when posted by individual consultants rather than the company page. The personal credibility made the difference in the decision stage.
Building attribution recipes that actually work
Standard UTM parameters tell you where traffic came from but not the full journey. Better attribution captures social's real impact.
The Extended Attribution Window
Most companies use 30-day attribution windows because that's what Google Analytics defaults to. For social media, especially B2B, you need 90-180 day windows minimum. Some enterprise deals need 12-month windows to capture the full influence path.
Set up three attribution windows:
-
First touch
What originally brought them into your ecosystem
-
Key engagement
Major interaction points along the journey
-
Last touch
Final interaction before conversion
Track assisted conversions, not just last-click. If social media introduced the prospect, email nurtured them, and search closed them, social gets assist credit.
Multi-Touch UTM Strategy
Basic UTM: utmsource=linkedin&utmmedium=social&utm_campaign=q4-campaign
Better UTM: utmsource=linkedin&utmmedium=social-organic&utmcampaign=inventory-series&utmcontent=post-3-warehouse&utm_term=jordan-personal
The enhanced version tells you:
-
Exactly which platform and post type
-
Which content series or theme
-
Which specific piece of content
-
Who posted it (company vs employee vs influencer)
Create a UTM recipe document that everyone follows. Nothing kills attribution faster than inconsistent tagging. Companies where half the team uses "linkedin" and half uses "LinkedIn" as the source end up with two separate data streams for the same platform.
The Hidden Influence Problem
Dark social (unmeasurable sharing through private messages, emails, Slack) accounts for huge portions of B2B social influence. You can't track it directly, but you can measure its impact.
Add "How did you hear about us?" fields to forms, but make them conversational:
-
"What made you interested in checking us out?"
-
"Did someone recommend us? Who?"
-
"What content or information convinced you to reach out?"
Around 40% of people will actually tell you the real influence source if you ask conversationally instead of giving them a dropdown menu.
Here's a visual of how the multi-touch attribution flow should look.
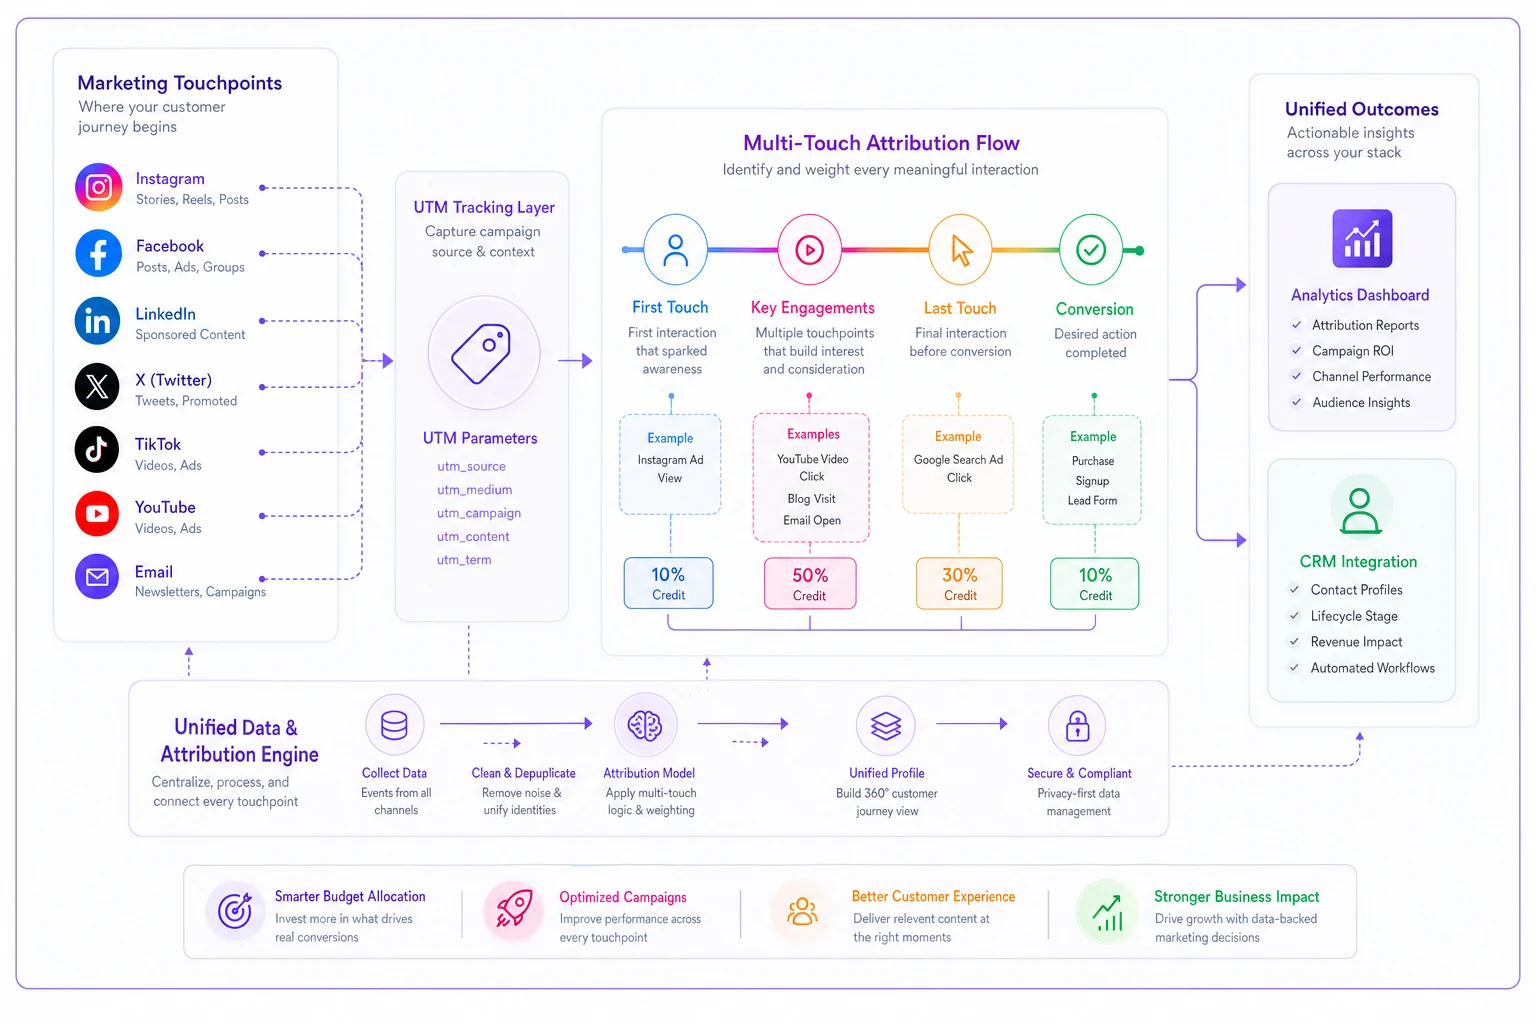
The graphic maps first touch through to closed deal and shows where extended windows and assisted conversion tracking capture social influence.
Creating stakeholder-ready reports that tell the real story
CEOs don't care about engagement rates. They care about pipeline and revenue. Your social media reports need to speak business language, not social media language.
The Executive Dashboard (What the C-Suite Actually Needs)
| Metric | Why Executives Care | How to Present It |
|---|---|---|
| Pipeline Influenced | Shows revenue impact | "Social touched $847k of pipeline this quarter" |
| Sales Cycle Impact | Proves efficiency value | "Social-influenced deals close 22 days faster" |
| Customer Acquisition Cost | Budget justification | "Social CAC: $1,200 vs Paid Search: $3,400" |
| Share of Voice | Competitive position | "We own 34% of industry conversations (up from 12%)" |
| Customer Quality Score | Long-term value | "Social customers have 40% lower churn" |
Never lead with follower counts or likes. Start with business impact, then explain the social metrics that drove that impact.
The Sales Team Dashboard (Proving You're Not Sending Garbage)
Lead Quality Metrics:
-
Company size and industry match rate
-
Engagement depth before conversion (multiple touchpoints = higher intent)
-
Content consumed before demo request
-
Response rate to sales outreach
-
Meeting show rate
-
Opportunity conversion rate
One software company discovered social leads had a 60% demo show rate versus 35% for paid search leads. The difference? Social leads had consumed an average of 4.5 pieces of content before booking, versus 1.2 for paid leads. They came educated and ready to buy.
The Day-to-Day Operations View
-
Content performance by format, topic, and posting time
-
Audience growth rate by platform
-
Engagement rate trends (declining might mean algorithm changes)
-
Community response time and sentiment
-
Employee advocacy participation and reach
-
Influencer mention tracking
But create a clear line between these operational metrics and the business metrics above. If engagement drops 20%, what happens to pipeline two months later? If you can't draw that connection, you're measuring activity, not impact.
Where operational software fills the attribution gaps
Manual attribution tracking breaks around 20-30 social posts per week across multiple platforms. You start missing data, inconsistent tagging creeps in, and reports take days to compile. That's when you need systems, not spreadsheets.
The challenge with social media measurement isn't just collecting data – it's connecting data streams that naturally resist connection. Your social platforms don't talk to your CRM. Your CRM doesn't properly track content consumption. Your analytics tool only sees the last click.
Modern operational platforms solve this by creating a unified tracking layer. They automatically apply consistent UTM parameters, track engagement across the full customer journey, and connect social interactions to actual revenue outcomes. They can track patterns humans miss – like which combination of content topics leads to the highest quality leads, or which employee advocates actually influence deals.
The real value comes from automation removing human error from the attribution process. When every link is properly tagged, every interaction is logged, and every conversion is tracked back to its original source, you finally get the complete picture of social's impact. These platforms can generate those stakeholder-ready reports automatically, saving social managers from spending half their week in spreadsheets.
Building your measurement system
Start with the outcome you want to prove, then work backward to the metrics. If you need to prove social drives revenue, you need:
-
Consistent UTM tracking on every single link
-
Extended attribution windows (minimum 90 days)
-
Multi-touch attribution model enabled
-
Qualitative data collection (ask people how they found you)
-
Regular reporting cadence that tells a story, not just shows numbers
-
Clear connection between social metrics and business outcomes
The biggest mistake companies make is trying to measure everything immediately. Pick one funnel stage, nail the measurement, prove the value, then expand. A B2B company started by just measuring how social influenced demo requests. Once they proved that connection, they got budget to measure the full funnel. Now they can track social's influence from first touch through customer expansion.
Pick one funnel stage, nail the measurement, prove the value, then expand.
Your measurement system will evolve as your social strategy matures. Early stage companies might focus purely on awareness metrics. Growth stage companies need consideration and conversion metrics. Enterprise companies track influence on expansion and retention.
The companies that win long-term are those that treat social media measurement as an operational system, not a monthly report. They build attribution into their process from the start, automate what they can, and consistently connect social activity to business outcomes. That's how you move from "we think social helps" to "social influenced $2.3M in closed deals last quarter."
If you can't measure social's impact, you're not doing social wrong – you're doing measurement wrong. Fix the measurement system, and suddenly social's value becomes impossible to ignore.
Ready to amplify your brand’s voice?
Join 2,500+ marketers using Postyly to save time, boost engagement, and grow their audiences effectively.