

Most social teams don't lose to competitors on creative quality. They lose because they can't decide fast enough whether a change actually worked. Someone swaps a thumbnail, the numbers wobble for a few days, and then three people in Slack argue about whether it's "trending up." Two weeks later nobody can remember what the original even looked like.
The fix isn't more rigor in the academic sense. You're not running a pharmaceutical trial. You're trying to answer a cheap question — keep this change or kill it — before the creative gets stale or the platform algorithm shifts under you. That's what a short social experiment playbook is for: tight windows, pre-committed decisions, and heuristics good enough to act on without a data science team.
This covers the 7–14 day window specifically, because that's where most social creative tests actually live. Shorter and you're reading noise. Longer and the context changes so much the result stops meaning anything.
Why the 7–14 day window is the sweet spot (and where it breaks)
The temptation is always to run tests longer "to be safe." In practice, long windows on social create more problems than they solve. Your audience composition shifts. A post goes semi-viral and skews everything. The platform pushes a new format and reach patterns change mid-test.
Seven to fourteen days is long enough to cover the weekly rhythm — weekday vs weekend behavior, the fact that your Tuesday audience is different from your Saturday audience — without dragging into a new content cycle. One full week is the floor because anything shorter means a single strong or weak day can flip your conclusion. Two weeks is roughly the ceiling for creative tests before freshness decay and external changes start contaminating the read.
Where it breaks, and this matters: the window only works if your baseline volume is high enough to see a difference inside it. A brand posting twice a week with 800 average impressions per post will not get a clean read in 14 days no matter how disciplined the setup is. The math just isn't there.
A rough filter worth using: if your variant won't accumulate at least a few hundred meaningful events (saves, link clicks, profile visits — whatever your KPI is) inside the window, the test is too slow for this format. Either batch more posts into the test or accept you're running a longer-horizon experiment, not a micro-test.
The three-decision structure every micro-test needs
Before you launch anything, write down three things. Not after. Before. The entire value of a short-window test comes from pre-committing, because once results start trickling in, people become remarkably creative at justifying whatever they already wanted to do.
Stop managing your social media the hard way.
Postyly helps you plan, schedule, and analyze every post with precision.
- Multi-platform scheduling
- Real-time engagement tracking
- Automated performance reports
No credit card required
-
Primary KPI — one metric, not a dashboard. The thing the creative change is actually supposed to move.
-
Minimum effect worth acting on — the smallest improvement that would change your behavior. If a 2% lift wouldn't change your content strategy, don't celebrate a 2% lift.
-
Stop/continue gate — the rule that ends the test and the rule that kills it early.
That third one is where most teams get lazy. They set a start date and no end logic. A proper gate has two triggers: a scheduled end (day 14, read the result) and an early-kill condition (if the variant is clearly dragging core performance, stop it before day 14 so you don't keep bleeding reach).
There's a deeper look at how to structure these pre-commitments across a whole program in the piece on experiment catalog governance for social teams — but for a single micro-test, those three lines in a shared doc are the minimum.
Significance heuristics you can actually use at this scale
You're not going to run a formal statistical test on 11 days of Instagram saves. The sample's too small, the data's too messy, and nobody on the team wants to argue about p-values in a standup. So you need heuristics — fast rules that are roughly right and keep you from fooling yourself.
Here's the practical set that holds up across most social KPIs:
| Signal strength | What you're seeing | Decision |
|---|---|---|
| Strong | Variant beats control by 20%+ across most days of the window, direction is consistent | Continue / adopt |
| Moderate | Variant leads by ~10–20% but with a few flipped days | Extend to 14 days or re-run once |
| Weak | Difference under ~10%, days flip back and forth | Treat as no result — keep control |
| Negative | Variant clearly trails, especially on your highest-volume days | Kill early |
Remove your single best day as a quick outlier check before locking the gate.
The two numbers that make these heuristics honest are consistency across days and magnitude. A 15% lift that holds on 9 of 11 days is far more trustworthy than a 40% lift driven entirely by one monster day. One viral post can manufacture a "win" that evaporates the moment you scale the change.
A useful gut check: look at the result with your single best day removed. If the conclusion flips, you don't have a result — you have an outlier. More of these traps are covered in common mistakes when A/B testing organic posts, and the single-day-outlier problem is near the top of the list.
Why "it went up" is almost never enough
The most common failure isn't bad math. It's reading a number going up and assuming the change caused it. Social metrics drift constantly — seasonality, news cycles, a reshare from a bigger account. If you don't have a control running at the same time, you can't separate your creative change from everything else moving in the background.
Same-window comparison beats before/after comparison almost every time. "This week vs last week" quietly assumes nothing else changed between the two weeks. Something always changed.
Ready-to-run experiment recipes
These are the micro-tests that actually fit a 7–14 day window and produce decisions, not debates. Each one is scoped to isolate a single variable.
Recipe 1 — Hook rewrite (video) Same video body, two different first-3-second openers. Publish one per channel or alternate across comparable time slots. Primary KPI: 3-second retention or hold rate. Window: 7 days if you post daily, 14 if you don't. Kill condition: if the new hook drops retention below the existing baseline on high-volume days.
Recipe 2 — Thumbnail / cover frame swap Identical content, different cover image. Best run on a channel where cover images actually drive click behavior. Primary KPI: click-through to the post or profile. This one gets contaminated easily, so lock everything else — caption, posting time, hashtags.
Recipe 3 — CTA placement Same creative, CTA at the start of the caption vs the end. Primary KPI: link clicks or saves. Small effect sizes expected here, so either run it across a batch of posts or extend to 14 days. Don't over-interpret a weak result.
Recipe 4 — Format swap (carousel vs single image) Same core message, two formats. Primary KPI: saves + shares combined (the "worth keeping" signal). This one has a bigger inherent difference, so results tend to be clearer inside the window.
Recipe 5 — Posting-time shift Same creative, two time windows. Primary KPI: early-hour reach velocity. Easy to run, easy to misread — audience composition changes by time of day, so a "win" here is really a mix of reach and audience, not creative quality. Label it honestly.
All five share the same structure: one variable, one KPI, one window, and a pre-written kill rule. The moment a test has two changed variables, you've lost the ability to attribute the result, and you're back to arguing.
A simple dashboard layout that forces a decision
Dashboards fail when they show everything. For a micro-test you want a view that makes the decision obvious to someone who wasn't in the planning meeting.
-
The one primary KPI, control vs variant, plotted by day across the window
-
Cumulative difference as a single running number (variant minus control, %)
-
The outlier check — same chart with the single best day greyed out
-
Days elapsed / days remaining against the committed window
-
A plain-language gate status line
"On track to adopt" / "No clear result" / "Kill triggered"
That last line is what actually matters. If a stakeholder has to interpret the chart themselves, they'll interpret it in whatever direction suits them. A dashboard that states the gate status removes the argument.
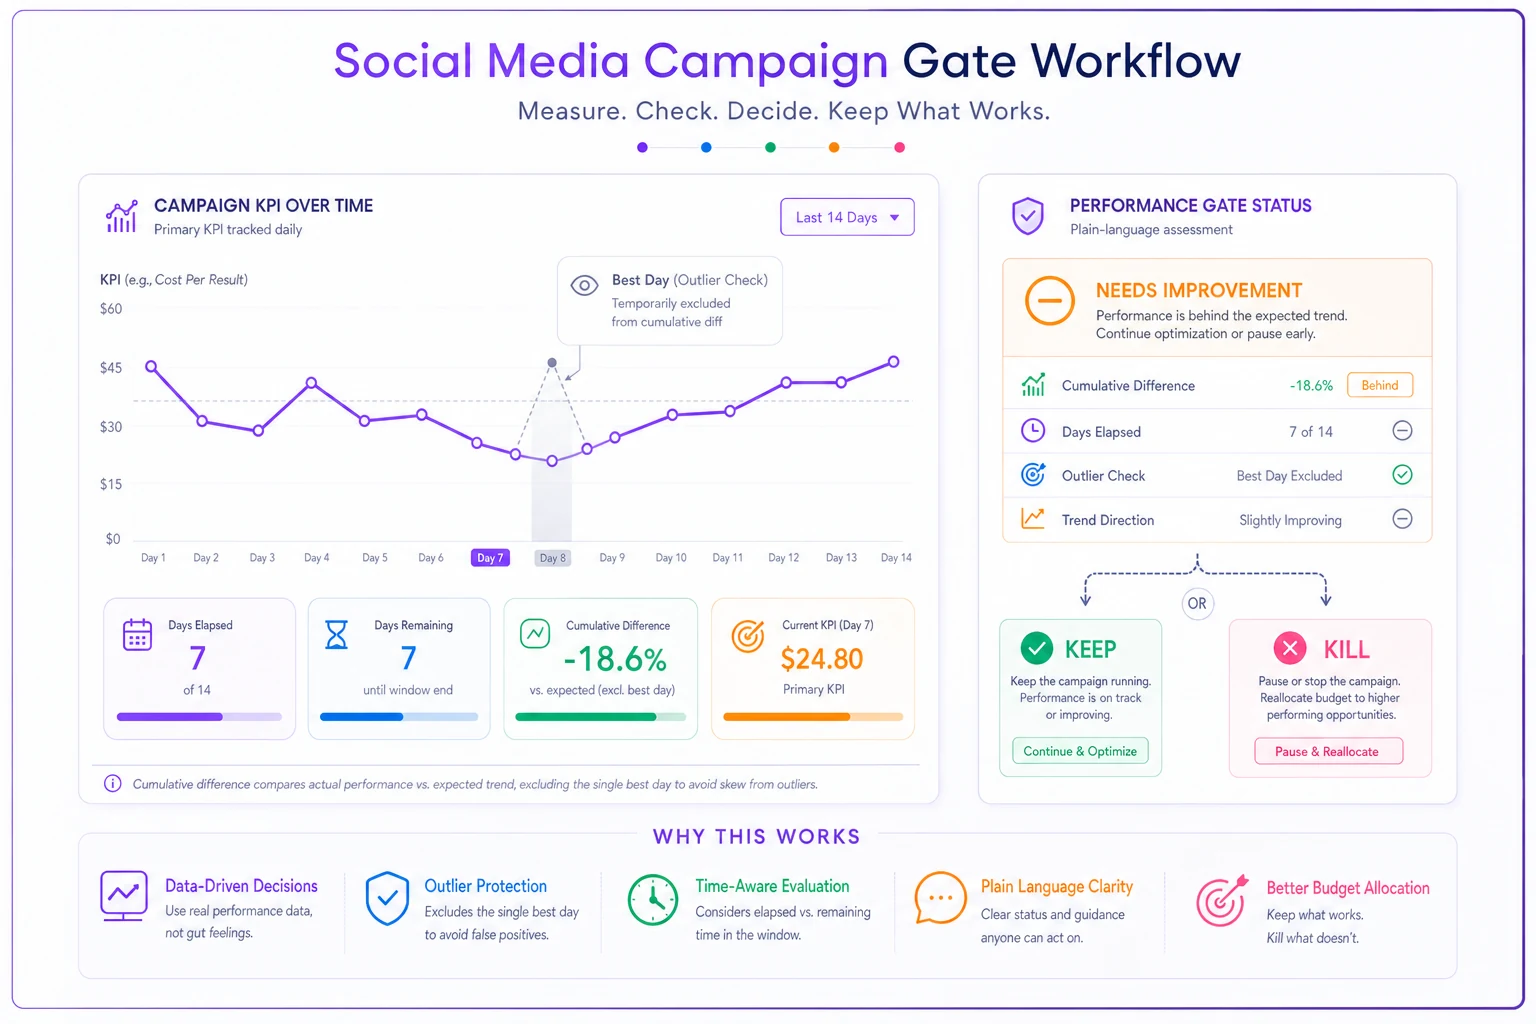
This sketch shows how the dashboard elements feed into a single gate status for fast decisions.
Secondary metrics belong on a second tab, not the main view. You check them after you've read the primary KPI, to make sure a "win" didn't quietly tank something else — like a hook that boosts retention but craters saves.
A real scenario
A mid-size regional outdoor-gear retailer — small social team, two people — kept redesigning their Reels hooks on vibes. Someone would decide a new style "felt stronger," they'd roll it everywhere, and reach would do whatever it was going to do anyway. No one could say if any of it worked.
They switched to 10-day hook micro-tests. One variable: the opening three seconds. Primary KPI: hold rate past the first three seconds. Pre-committed gate, kill condition written down.
First test, the fancy animated hook they were all excited about actually trailed the plain talking-head opener — by roughly 12–15% on hold rate, consistent across most of the window. With their best day removed, the gap held. That killed a redesign they were about two days from rolling out across every channel.
Over the next couple months they ran maybe eight of these. Not every test produced a winner — several came back "no clear result," which is its own kind of answer. But the two that did win lifted average hold rate somewhere in the 18–20% range on the content they applied it to. More importantly, the Slack arguments mostly stopped. There was a doc, a gate, and a number.
The lift was nice. The bigger win was decision speed — they stopped sitting on undecided creative for weeks.
When this approach makes sense — and when it doesn't
When it works well:
-
You post frequently enough to accumulate real volume in 7–14 days
-
The change is a single, isolatable variable
-
You care about a fast keep/kill decision more than a perfect measurement
When it's a bad idea:
-
Low posting volume where the window can't gather enough data
-
Brand or positioning changes that need longer to register with an audience
-
Anything where the "result" depends heavily on a single viral post you can't reproduce
Who should skip it entirely:
Teams that won't actually honor the gate. If you're going to override a clear "no result" because someone loves the creative, don't run the test — you'll just be laundering a decision you already made through a process that looks objective. That's worse than no test, because it burns trust in the whole experimentation program.
The part teams skip: writing down the "no result"
The most undervalued output of a micro-test is a clean null. Half of good experimentation is learning what doesn't move the needle so you stop spending creative energy there. But nulls feel unsatisfying, so people quietly drop them and only log the wins.
That's how teams end up re-testing the same failed idea three times a year under slightly different names. If your micro-tests only ever produce "winners," you're not running experiments — you're collecting confirmations.
Keep a short log: what you tested, the window, the KPI, the gate decision, and whether it was adopted, killed, or came back null. Nothing fancy. The value compounds fast once you can look back and see what's already been answered.
Pre-launch checklist
Before any 7–14 day micro-test goes live:
-
[ ] One primary KPI defined (not a dashboard)
-
[ ] Minimum effect worth acting on written down
-
[ ] Only one variable changed between control and variant
-
[ ] Control running in the same window, not before/after
-
[ ] Scheduled end date committed
-
[ ] Early-kill condition written down
-
[ ] Baseline volume checked — enough events to read a result
-
[ ] Outlier check planned (best-day-removed)
-
[ ] Gate status owner assigned (who reads it, who decides)
-
[ ] Result slot ready in the test log — including room for a null
Run through that list and most of the ways short-window tests go wrong are already closed off before launch.
Tight playbooks aren't about precision — they're about speed with discipline. You're trading statistical perfection for the ability to decide this week instead of arguing next month. For social teams, that trade is almost always worth making, as long as you respect the gate you set.
Ready to amplify your brand’s voice?
Join 2,500+ marketers using Postyly to save time, boost engagement, and grow their audiences effectively.