


Every social media manager knows this frustration. Instagram says your campaign reached 45,000 people. Facebook Business Manager says 52,000. Your third-party analytics tool shows 38,000. Meanwhile, the CMO wants the actual number for the board presentation tomorrow.
This isn't just conflicting numbers — it's your entire data architecture falling apart at the moment you actually need it. Most teams patch together data from multiple sources without ever establishing proper normalization rules or pipeline governance. The result is nobody trusts the numbers, decisions get delayed, and you spend more time explaining discrepancies than optimizing campaigns.
The source problem nobody wants to discuss
Platform APIs change constantly. Meta adjusts metric definitions quarterly. TikTok's API provides different data granularity than LinkedIn's. Twitter (X) deprecates endpoints without warning. Most teams only find out about these changes when their reports suddenly look wrong.
What typically happens: a retail brand runs a multi-platform campaign. They pull engagement data from native platform analytics, combine it with UTM-tagged website traffic, add customer data from their CRM, and generate a performance report. Simple enough — except each source defines "engagement" differently. Instagram counts a 3-second video view as engagement. LinkedIn requires actual interaction. TikTok has its own threshold. Without normalization rules, you're comparing apples to oranges to bananas.
The architecture problem runs deeper than definitions. Each platform delivers data at different intervals with different retention windows. Instagram Insights keeps detailed data for 90 days. LinkedIn keeps some metrics for 365 days but aggregates others after 30. If you're pulling historical data for year-over-year comparisons, these windows create real gaps in your analysis.
Then there's the API rate limit maze. Pull too much data too fast from Meta and you hit limits. Space out your requests too much and you miss real-time optimization windows. Most teams end up with incomplete data pulls, missing metrics, and reports that never quite match what they see in native dashboards.
Building pipelines that actually handle platform chaos
A functional data architecture for social analytics starts with accepting that perfect data synchronization is impossible. Build for consistency and transparency about limitations instead.
Stop managing your social media the hard way.
Postyly helps you plan, schedule, and analyze every post with precision.
- Multi-platform scheduling
- Real-time engagement tracking
- Automated performance reports
No credit card required
Raw data ingestion: Pull everything available from each source, timestamp it, and store it exactly as received. Never transform data at ingestion. This gives you an audit trail and the ability to reprocess when you discover normalization errors months later.
Normalization and mapping: Create explicit rules for how each platform's metrics map to your standardized definitions. Video views might normalize to "3+ second views" across all platforms, with clear documentation about what gets excluded — like Instagram's 1-second previews.
Business logic layer: Apply campaign tags, cost allocation, attribution windows, and other business-specific transformations. This is where you join social metrics with CRM data, apply UTM attribution, and generate the metrics your team actually uses.
Most teams try to do all three at once, which is why their pipelines break constantly. When Meta changes a metric definition, you should only need to update the normalization layer — not rebuild your entire reporting infrastructure.
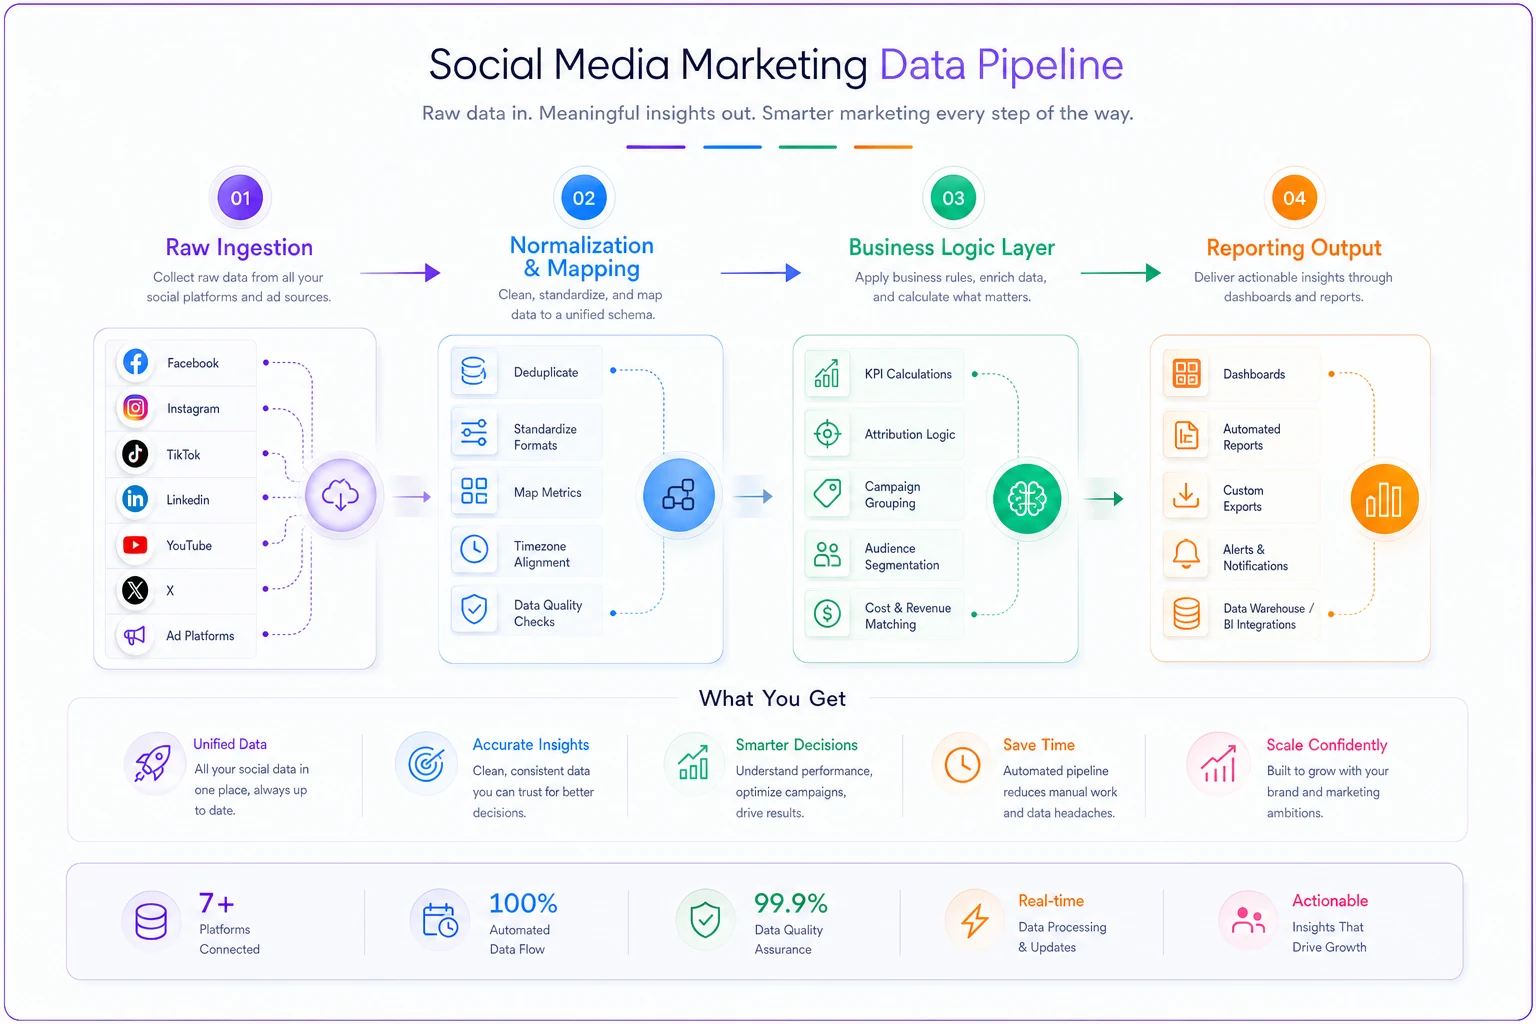
Keep these layers cleanly separated from day one. Retrofitting separation into a tangled pipeline later is genuinely painful.
Normalization rules for metrics that actually matter
Generic engagement rates are pretty much useless in isolation. A 2% engagement rate on LinkedIn means something completely different than 2% on TikTok. Your normalization rules need to account for platform behavior patterns, not just mathematical definitions.
Reach normalization: Use unique accounts reached as the baseline, not impressions. Define clear windows — 24 hours, 7 days, 28 days — and stick to them. When platforms provide overlapping reach data, always use the longer window for consistency.
Engagement depth scoring: Create weighted engagement scores based on effort required. A share might be worth 3 points, a comment 2 points, a like 1 point. This lets you compare engagement quality across platforms that have different interaction types.
View-through standardization: Pick one threshold — 3 seconds, 25% completion, or full view — and map all platforms to it. Document what each platform's native metric actually means and how much data you're excluding with your standardization.
Click attribution windows: Standardize on either 1-day view/28-day click or 7-day view/28-day click across all platforms. Mixing attribution windows between reports makes it nearly impossible to reconcile performance data.
One thing worth noting from working with a lot of marketing operations teams: pick normalization rules that slightly underreport rather than overreport.
| Platform | Native Engagement Definition | Normalized to | Notes |
|---|---|---|---|
| Likes, comments, saves, shares, 3s video views | Weighted score (interactions only) | Excludes 1s video previews | |
| Reactions, comments, shares, clicks | Weighted score | No organic impression demographics | |
| TikTok | Likes, comments, shares, completions | Weighted score | Completion threshold varies |
| Reactions, comments, shares, clicks | Weighted score | Attribution window must match Meta Ads |
These definitions will drift over time as platforms update. Treat this table as a living document, not a one-time setup.
UTM and CRM joining that doesn't break monthly
The theory sounds simple: tag all social links with UTMs, join that traffic data with your CRM, and measure actual conversions. The reality involves dozens of failure points that most teams only discover after losing months of attribution data.
-
Source
platform name (instagram, linkedin, tiktok)
-
Medium
always "social" for organic, "paidsocial" for paid
-
Campaign
campaign identifier that matches your internal naming
-
Content
creative variant or post ID
-
Term
audience segment (optional, mainly for paid)
The critical part is establishing a single source of truth for UTM generation. Whether it's a spreadsheet, a URL builder tool, or automation that generates them from campaign briefs, centralize it. Distributed UTM creation always leads to inconsistent tagging and broken attribution.
For CRM joining, the architecture needs to handle three realities. First, timing mismatches — someone clicks your Instagram link on Tuesday, fills out a form on Thursday, and enters your CRM on Monday when sales qualifies the lead. Your join logic needs attribution windows that account for these delays. Second, incomplete data passes — not every UTM parameter makes it through every system. Some form tools strip certain parameters. Some CRMs truncate long values. Build your join logic to work with partial matches when necessary. Third, volume mismatches — if Instagram shows 1,000 link clicks but Google Analytics shows 400 sessions with that UTM, you need consistent rules for reporting those gaps. Usually it's bot traffic, privacy settings, or JavaScript blocking, but document how you're handling it either way.
The retention playbook everyone needs but nobody documents
Data retention isn't just about storage costs. It's about maintaining historical accuracy when platforms change their metrics, APIs deprecate, or you need to reprocess old campaigns with updated attribution logic.
Daily snapshots for 90 days: Store complete daily pulls of all metrics for three months. This handles most reprocessing needs and platform API limitations.
Weekly aggregates for 18 months: After 90 days, aggregate to weekly granularity. You lose some precision but maintain trend analysis capability.
Monthly summaries indefinitely: Keep monthly rollups forever. Storage is cheap, and you'll need these for year-over-year comparisons.
Retention without versioning is useless though. When you update normalization rules, you need to know which version produced which metrics. Tag every processed dataset with the pipeline version number, normalization rules version, processing date, and source API versions at time of pull.
This versioning approach saved a consumer brand's analytics team when Meta retroactively changed how they calculated reach. They could reprocess six months of campaigns with the new definitions while still showing historical reports with the original numbers for consistency.
Change control that prevents metric chaos
Every platform update, every new campaign type, every attribution model adjustment can break your reporting. Without change control, you're constantly firefighting metric discrepancies instead of optimizing performance.
-
Testing environment
Never test normalization changes in production. Set up a parallel pipeline that processes the same data with proposed changes. Compare outputs for at least 10 campaigns before promoting anything.
-
Rollback capability
Every pipeline change needs a rollback plan — versioned configurations, not hardcoded transformations. When Facebook breaks something (and they will), you need to revert within hours, not days.
-
Stakeholder communication
Create a simple changelog that non-technical stakeholders can understand. "Updated Instagram engagement definition to exclude story replies" is clearer than "Modified transformation logic in pipeline v2.3.1."
-
Metric reconciliation periods
When you must change metric definitions, run parallel reports for at least one month. Show both old and new methodologies side-by-side so stakeholders can understand the actual impact.
Teams that skip change control usually regret it around month four when something breaks and nobody can trace why the numbers shifted.
Building trust when nobody believes the numbers
The technical architecture means nothing if stakeholders don't trust the output. Building on funnel metrics that actually drive decisions, trust comes from transparency about limitations — not claims of perfect accuracy.
Document and communicate these realities upfront. Be explicit about what each platform doesn't provide — LinkedIn doesn't give impression demographics for organic posts, Instagram aggregates some metrics after 7 days. Document these gaps in every report, not just in some internal wiki nobody reads.
Not all metrics are equally reliable either. Direct response metrics like clicks and conversions are highly accurate, while reach and impression data have wider confidence intervals. Tag each metric with a reliability indicator so stakeholders know what they're looking at.
Define acceptable discrepancy ranges. A 5–10% difference between platform-reported and pipeline-processed metrics is often normal. A 30% gap indicates a problem. Set alerts for when discrepancies exceed your thresholds so you're not discovering issues during a board presentation.
Make every number traceable back to its source — log raw API responses, transformation steps, and final outputs. When someone questions a metric, you should be able to show exactly how it was calculated. That traceability is what eventually gets stakeholders to stop questioning the data and start using it.
Practical implementation roadmap
Don't try to build the perfect data architecture for social analytics in one sprint. Here's a realistic rollout:
-
Month 1
Set up raw data ingestion for your three most important platforms. Store everything, transform nothing. Get comfortable with API quirks and rate limits before adding complexity.
-
Month 2
Build normalization for one metric category — usually engagement or reach. Test it thoroughly. Document every decision you make.
-
Month 3
Add UTM standardization and basic CRM joining. Start with form submissions before tackling complex conversion paths.
-
Month 4
Implement change control and versioning. Run your first parallel testing period with a minor normalization update.
-
Month 5
Add automated anomaly detection and discrepancy alerts. Set conservative thresholds initially — you can tighten them later.
-
Month 6
Build stakeholder dashboards with confidence intervals and limitation disclaimers. Start monthly reconciliation meetings.
Teams that succeed treat this as an operational system that needs ongoing maintenance, not a one-time project. Platforms change, metrics drift, and new requirements emerge constantly.
When AI automation changes the game
Modern operational platforms handle much of this pipeline complexity automatically. AI-powered systems can detect when platform APIs change, adjust normalization rules, and flag anomalies before they surface in reports.
Similar to separating earned and paid metrics, AI automation is particularly useful for maintaining consistency across complex data streams. These platforms monitor for API changes, automatically update field mappings, and maintain audit trails without manual intervention. Some can detect when a platform's metric definition shifts subtly and alert you to review your normalization rules before anything breaks downstream.
The real value is context-awareness. When Instagram changes how they count video views, the system doesn't just flag the change — it suggests normalization adjustments based on your historical patterns and business goals. That kind of proactive handling reduces the firefighting that typically consumes social analytics teams.
Real-world transformation
A D2C fashion brand struggled with exactly this problem. Three agencies, five platforms, and nobody could agree on campaign performance. Instagram showed strong engagement, web analytics showed weak conversion, and paid media reports contradicted both.
The architecture overhaul took about four months. They centralized all data ingestion, established clear normalization rules based on their business model — focusing on consideration-phase metrics that correlated with purchase intent — and built UTM discipline into their workflow from the start.
The breakthrough came from accepting imperfection. Instead of chasing perfect metric alignment, they documented known discrepancies, established confidence intervals, and focused on trend consistency rather than absolute accuracy. They also built competitive intelligence pipelines to benchmark their metrics against industry patterns and give leadership more context around performance.
Six months later, report preparation time dropped from roughly three days to around four hours. Stakeholder questions about metric discrepancies nearly disappeared. Most importantly, they could finally connect social activity to revenue with reasonable confidence — surfacing close to $2.8M in attributed revenue that was previously invisible in their reporting.
The architecture evolves with your operation
Small teams don't need enterprise-grade data pipelines. Start with the basics: consistent UTM tagging, daily data pulls, and simple normalization rules. Add sophistication as you scale.
What matters is building a foundation that won't crumble when you add new platforms, change attribution models, or have to explain last quarter's performance to stakeholders who suddenly care a lot about social metrics. The teams that get this right don't have perfect data — they have transparent, consistent, and improvable data operations. Accept that perfect synchronization is impossible, build for consistency over absolute accuracy, document everything, and maintain the system actively. Stakeholders don't need perfect metrics. They need metrics they can trust, understand, and actually act on.
Stakeholders don't need perfect metrics. They need metrics they can trust, understand, and actually act on.
Ready to amplify your brand’s voice?
Join 2,500+ marketers using Postyly to save time, boost engagement, and grow their audiences effectively.