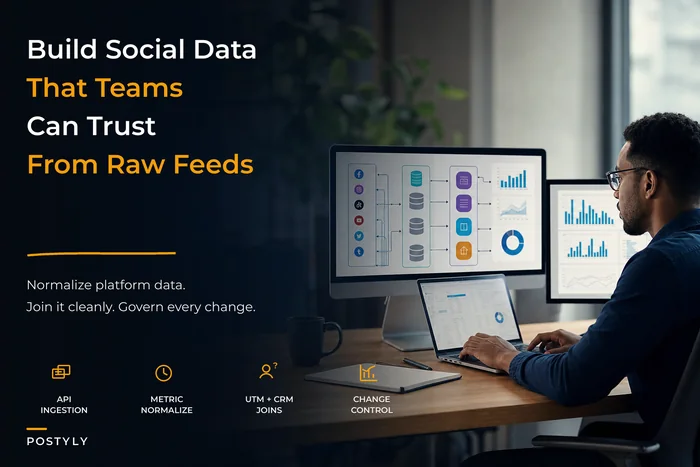



The worst part about broken social metrics isn't the moment you catch them. It's the three weeks before that — when you're making budget calls, telling your boss what's working, and shifting spend based on numbers that stopped meaning what you think they mean.
That gap between when a metric drifts and when someone notices is where measurement trust actually dies. On social, that gap is almost always longer than anyone admits. The platforms change under you constantly, UTMs get mangled by whoever built the last campaign, and half your "conversions" are being counted twice by tools operating off completely different definitions.
Social metric contracts and SLOs are how mature teams close that gap. Not by making the data perfect — that's not possible — but by making every important number owned, defined, and monitored so when something breaks, someone knows within a day instead of a quarter. This is the operational layer most social teams skip, and it's the one that separates "we think engagement is up" from "we can actually defend this number to finance."
Why measurement trust breaks on social specifically
Every analytics discipline deals with drift. Social is structurally worse for a few reasons that don't get nearly enough attention.
The data sources are hostile. You don't control Meta's API, TikTok's reporting delays, or LinkedIn's decision to quietly redefine "video view" from 2 seconds to 3 seconds on some random Tuesday. When a platform changes a metric definition, they rarely announce it in a way your reporting stack will catch. The number just moves, and your quarterly trend line develops a mysterious step-change that two meetings will blame on a "strategy shift."
Social also lives at the seam between paid and organic, which means metrics get double-counted or split inconsistently depending on who pulled the report. A video view from a boosted post might show up in organic reach and paid impressions depending on timing window and tool. If your team hasn't worked out how to separate earned and paid reach, you're not measuring performance — you're measuring which tool ran the export.
Then there's the tagging layer, which is fragile and entirely human. UTMs get typed by hand, copied from old campaigns, mangled by link shorteners. One person uses utmsource=facebook, another uses utmsource=fb, a third types Facebook with a capital F, and now your source report has three rows for the same channel. Nobody did anything wrong exactly. There was just no contract.
A metric contract is the fix for all three. It's a small, boring document that answers: who owns this number, what exactly does it mean, where does it come from, and how fresh does it need to be. Once that exists, drift becomes visible instead of invisible.
What actually goes in a metric contract
Think of it as the spec sheet for a single number. Not a dashboard, not a report — one metric. You do it per-metric because ownership and freshness requirements genuinely differ. Your CFO cares if attributed revenue is stale by a day. Nobody is getting paged at 2am because saved-post counts lagged.
Stop managing your social media the hard way.
Postyly helps you plan, schedule, and analyze every post with precision.
- Multi-platform scheduling
- Real-time engagement tracking
- Automated performance reports
No credit card required
A workable contract covers these fields:
-
Metric name — the canonical name, not the four aliases people use in Slack
-
Owner — a specific person or role, not "the analytics team"
-
Definition — the exact logic, including edge cases and what's excluded
-
Source mapping — which platform, which API endpoint or export, which field
-
Transformation notes — dedup rules, timezone, currency, attribution window
-
Freshness SLO — how current the data must be, and what happens when it isn't
-
Alert thresholds — the conditions that trigger a warning vs. an incident
-
Known quirks — platform-specific gotchas documented so the next person doesn't have to relearn them by getting burned
That last field matters more than it looks. Most of the real pain in social measurement is tribal knowledge sitting in one senior analyst's head. When they leave, the team inherits a minefield.
A filled example: paid link clicks
| Field | Value |
|---|---|
| Metric name | paidlinkclicks |
| Owner | Paid Social Lead |
| Definition | Clicks on the destination URL from paid placements only. Excludes clicks on profile, hashtags, expand-caption. Excludes organic reach on boosted posts. |
| Source mapping | Meta Ads API → inlinelinkclicks; TikTok Ads → clicks (destination) |
| Transformation | Dedup by ad_id + day. All timestamps normalized to UTC then converted to ET for reporting. Attribution: 7-day click, 1-day view. |
| Freshness SLO | Updated within 6 hours; max staleness 12 hours before incident |
| Alert thresholds | Warn if daily volume swings >40% vs. trailing 7-day median; incident if source returns null for >4 hours |
| Known quirks | Meta's inlinelinkclicks ≠ link_clicks; the latter includes clicks to other destinations. TikTok reporting lags ~3 hours during peak. |
That's it. Fits on a screen. But notice how many arguments it prevents. The paid-vs-organic split is settled. The attribution window is settled. The reason "link clicks" doesn't match between two dashboards is documented — one uses inlinelinkclicks, the other link_clicks. Now everyone knows why, instead of spending thirty minutes in a Slack thread relitigating it.
Freshness SLOs: the part everyone gets wrong
The mistake is treating all data with the same urgency. Teams either set no freshness expectations at all so stale data goes unnoticed, or they set aggressive alerts on everything and people start ignoring them within a week because most of the alerts don't matter anyway.
The fix is tiering. In practice, you usually end up with three:
-
Tier 1 — decision-grade. Metrics that directly drive spend or get reported upward. Attributed revenue, cost per result, paid conversions. Freshness SLO measured in hours. A breach is an incident.
-
Tier 2 — operational. Metrics the team uses daily but that won't cause a bad budget call if they're a few hours late. Reach, impressions, CTR. Freshness SLO measured in half-days.
-
Tier 3 — contextual. Saves, shares, follower deltas, qualitative signals. A day of lag is fine. No paging.
This tiering protects your alerting from becoming noise. When every alert can wake someone up, none of them do.
A freshness SLO also needs a defined response, not just a threshold. "Attributed revenue is stale more than 6 hours" should map to a specific action: check the connector, check the platform status page, post in the incident channel. Without that, an SLO is just a number nobody acts on.
Reconciliation recipes: catching drift before it spreads
Contracts define what a number should be. Reconciliation confirms it still is. This is the routine that catches most silent drift, and it's surprisingly rare to see teams run it with any real consistency.
A reconciliation recipe is a scheduled comparison between two sources that should agree, with a documented tolerance for how much disagreement is normal. Some pairs worth running regularly:
-
Platform native vs. your data warehouse. Does the number in Meta Ads Manager match your BI tool? A 2–3% gap from timezone or refresh timing is normal. A 30% gap means something broke in the pipeline.
-
UTM-tagged sessions vs. platform-reported clicks. Your analytics should see roughly the traffic the platform says it sent. When the platform reports 5,000 clicks and you see 1,200 tagged sessions, you have a tagging or redirect problem — not a performance problem.
-
Sum of campaign-level spend vs. account-level spend. These should tie out exactly. When they don't, a campaign got dropped from an export somewhere.
Writing these as recipes — with both sources, the join key, the tolerance, and the check frequency — means anyone can run them, and results are comparable over time. A reconciliation that lives in one analyst's ad-hoc spreadsheet dies the day they go on vacation. This is really an extension of your broader social data architecture and normalization rules — reconciliation is where those normalization decisions get tested against reality.
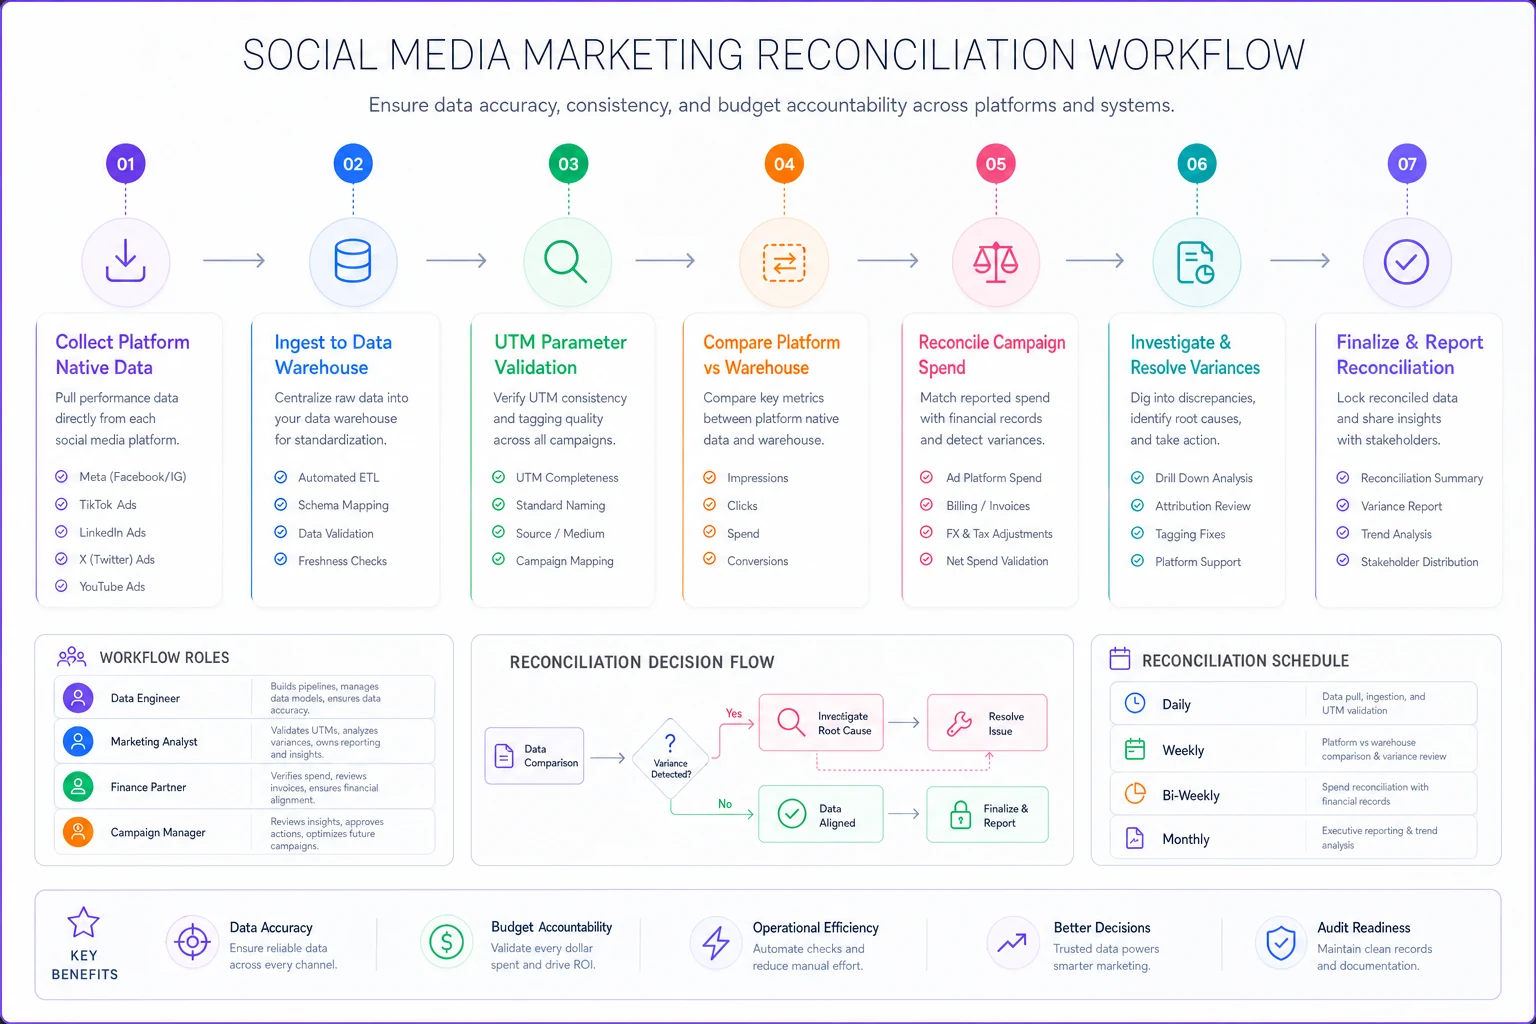
Use a simple diagram or checklist so anyone can run the recipe without digging through another analyst's notes.
Run the UTM reconciliation weekly to catch template copy errors early.
The UTM drift pattern nobody schedules for
UTM drift deserves its own section because it's the most common source of quiet data corruption and one of the easiest to prevent.
A typical example: a team launches a new campaign, someone copies the tracking template from a Q2 campaign, forgets to update utm_campaign, and for eleven days new spend gets attributed to an old campaign name. Nobody notices because total traffic looks fine. Only when someone tries to report on the new campaign specifically do they find it has almost no data.
A weekly UTM reconciliation catches this. Pull all inbound tagged traffic, group by source/medium/campaign, and flag anything that doesn't match your approved value list. New unexpected values get reviewed. Old campaigns that shouldn't still be receiving traffic get flagged. It takes maybe fifteen minutes and prevents the "why is our new campaign invisible" fire drill.
Alert thresholds that don't cry wolf
Alerting on social metrics is genuinely hard because the underlying data is naturally volatile. A post going viral is not an incident. A weekend traffic dip is not an incident. If you alert on raw thresholds, you'll be drowning in noise within a week.
Better thresholds are relative and contextual:
-
Compare against a trailing median rather than a fixed number, so seasonal patterns don't trigger false alarms.
-
Alert on shape, not just level. A metric going flat-line to zero is more suspicious than a 40% drop — a hard zero usually means the pipe broke, while a drop might be real performance.
-
Separate "data is missing" alerts from "data looks weird" alerts. The first is almost always a technical failure. The second needs a human to judge.
One pattern worth borrowing: a "did anything change" alert that fires when a platform metric's ratio to another metric shifts significantly. If your average video-view-to-impression ratio suddenly jumps, that often signals a platform quietly changed what counts as a view — before any announcement. Watching relationships between metrics catches definitional drift that watching single metrics never will.
The quarterly measurement audit runbook
Contracts and alerts handle the day-to-day. But social platforms change slowly and constantly, and a lot of drift accumulates below alert thresholds. That's what the quarterly audit is for — a scheduled re-verification that your whole measurement layer still matches reality.
A runbook that works:
-
Pull the contract inventory. List every metric contract and its last-verified date. Anything unverified in over 90 days goes to the top of the list.
-
Re-run every reconciliation recipe manually. Even the automated ones. You're checking whether tolerances have quietly widened.
-
Diff platform definitions. Review each platform's metric documentation and changelog against your contracts. Platforms update these constantly and rarely loudly.
-
Audit the UTM value list. Compare approved values against what's actually appearing in traffic. Retire dead campaigns, standardize new stragglers.
-
Check ownership. People change roles. An owned metric with an owner who left the team is an unowned metric. Reassign.
-
Review alert history. Which alerts fired? Which were real? Which were noise? Tune thresholds based on actual signal-to-noise from the last quarter, not guesses.
-
Document what changed and update contracts. The audit is worthless if the findings don't flow back into the contracts.
Teams that do this well treat the quarterly audit the same way accounting teams treat closing the books — boring, non-negotiable, and quietly load-bearing. This governance rhythm fits naturally into a broader social data operating model, where ownership and cadence are already defined for the wider stack.
Remediation playbooks: what to do when it breaks
Detection without a response plan just gives you faster anxiety. Each common failure should have a short playbook so the person on the hook isn't inventing a fix under pressure.
API definition change (a metric shifted meaning). Freeze the affected metric in reporting with a note. Confirm the change against platform docs. Update the contract definition and add a "definition changed on [date]" marker so trend lines get annotated instead of misread. Backfill only if the platform provides historical data under the new definition — otherwise document the break point and don't try to make the two eras look comparable.
Pipeline null / connector down. Confirm it's the pipe, not the platform, by checking the platform UI directly. If the platform has data and your warehouse doesn't, it's a connector issue — reauthenticate or re-run the job. If neither has data, it's a platform outage. Note it and wait. Don't spend hours debugging your own stack when the problem is on their end.
UTM drift detected. Identify the affected date range and campaigns. Where possible, remap the mistagged traffic to the correct campaign in your reporting layer. Fix the source template so it stops. Add the corrected value to the approved list.
Reconciliation gap outside tolerance. Don't publish the affected report until you've localized the gap. Check the usual suspects in order: timezone mismatch, attribution window mismatch, one source missing a segment, dedup logic failure. Nine times out of ten it's one of those four.
Each playbook should be short, actionable, and linked from the metric contract so the person on duty can find it quickly.
When this level of rigor makes sense — and when it doesn't
This whole system is overhead. Worth being honest about that.
It makes sense when you're spending enough that a wrong number costs real money, when multiple people pull reports and get different answers, or when you're reporting to people who'll make decisions based on your numbers. Once spend crosses into serious territory and more than a couple of people touch the data, the contracts pay for themselves the first time they prevent a bad budget call.
It's overkill for a solo operator or a small team running one or two channels on modest spend. If you can hold every definition in your head and you're the only one pulling reports, a full contract system is bureaucracy you don't need yet. Start with the two or three metrics that drive actual money decisions and skip the rest until you feel the pain.
Teams that won't maintain it probably shouldn't build it either. A metric contract system that goes stale is arguably worse than none, because people trust it while it lies. If nobody's going to run the quarterly audit, don't build the machinery that assumes someone will.
A real scenario
A mid-size DTC brand running paid social across Meta and TikTok, spending somewhere around $80k–$95k a month, kept getting different ROAS numbers from their agency dashboard and their internal BI tool. The gap ran anywhere from 15% to 40% week to week, and every performance review turned into an argument about whose number was right rather than a conversation about what to do about performance.
The root causes were mundane. The two systems used different attribution windows. TikTok's reporting lag meant same-day pulls under-counted. And a UTM template error had been mis-attributing roughly a fifth of their prospecting traffic for about six weeks.
They didn't buy anything new. They wrote metric contracts for their eight decision-grade metrics, set up three reconciliation recipes to run weekly, tiered their freshness SLOs, and ran one full audit. Within a couple months the two systems agreed to within a few percent, and the next UTM error got caught inside a week instead of six. Performance reviews stopped being about the data. That was the whole point.
The real payoff
Measurement trust isn't a dashboard feature. It's the accumulated result of every important number being owned by someone, defined precisely, checked on a schedule, and monitored for drift. Social makes this harder than almost any other channel because the ground genuinely moves under you — but that's exactly why the discipline matters more here, not less.
You don't need to contract every metric or automate everything on day one. Start with the handful of numbers people actually make decisions on. Write down what they mean and who owns them. Set up one reconciliation you'll actually run. The first time a contract catches a platform change before it corrupts a quarter of reporting, the overhead will have earned its keep — and your numbers will start meaning what everyone assumes they already mean.
Measurement trust isn't a dashboard feature. It's the accumulated result of every important number being owned by someone, defined precisely, checked on a schedule, and monitored for drift. Social makes this harder than almost any other channel because the ground genuinely moves under you — but that's exactly why the discipline matters more here, not less.
You don't need to contract every metric or automate everything on day one. Start with the handful of numbers people actually make decisions on. Write down what they mean and who owns them. Set up one reconciliation you'll actually run. The first time a contract catches a platform change before it corrupts a quarter of reporting, the overhead will have earned its keep — and your numbers will start meaning what everyone assumes they already mean.
Ready to amplify your brand’s voice?
Join 2,500+ marketers using Postyly to save time, boost engagement, and grow their audiences effectively.